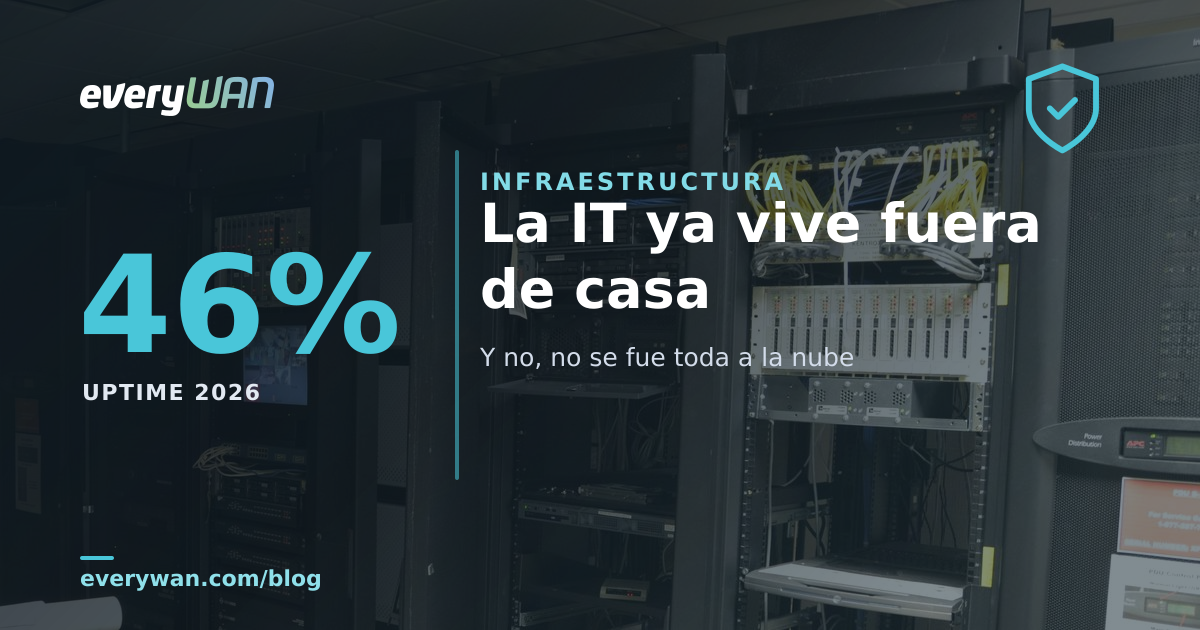
Last week a number went round that got shared a lot and read very little: for the first time, most corporate IT workloads no longer live in a data centre owned by the company itself. Forty-six per cent outside, forty-four inside. The figure is solid and comes from a serious source. The sentence that got stuck on top of it — "so the cloud won after all" — is not in the report, and the report actually says something rather different. The best part, in fact, is not in the headline: it is in the 10% left over from that sum, and in what has happened to kilowatts per rack.
What the figure actually says
It comes from Uptime Institute's sixteenth annual data centre survey, announced on 28 July 2026 with fieldwork run in April and May. The workload split is this: 46% in third-party facilities, 44% in company-owned data centres and 10% in "IT rooms and server cabinets" rather than a dedicated facility. It is the first time the first figure has passed the second, and Uptime projects the third-party share reaching 48% by 2028. (On what happens to the 44%, the coverage does not agree: Network World takes it down to 42% and The Register says it stays put. We are leaving it there, because the difference matters less than the direction.)
Before building anything on top of it, the small print, because it changes a good deal about who the number is for. More than 1,600 people took part; the core of the report is over 800 data centre owners and operators, and it is of that group that Uptime says 52% sit in North America and Europe and that close to one in four work for third-party IT or data centre service providers. Uptime itself warns that sample sizes vary by question because answering was not mandatory. Translated: this measures the data centre industry from the inside. It is not a census of the Spanish SME. If your company has a rack on an industrial estate outside Manresa, you are not in that sample. It tells you which way the wind is blowing, not "this is what is happening in your sector".
That 46% puts two opposite decisions in the same box
Here, for us, is the problem with the easy reading. Uptime's "third-party facilities" category bundles colocation, cloud, hosting and SaaS. That is four things, and at least two of them are opposite decisions in everything that matters: who owns the hardware, who patches what, how you pay and how long it takes to leave.
Adding those two columns together and calling the result "off premises" is correct. Calling it "the cloud" is not. And that is where this article's thesis comes from, and it is one sentence: the 46% shows that companies have stopped wanting to own the building. It does not show that they have stopped wanting to own the machine. Those are two different decisions, taken for different reasons, and only one of them is about the cloud.
It has to be said: we do colocation with our own hardware in a data centre, so we are an interested party in this particular reading. Which is why we would rather leave it in the numbers and not in the adjectives. And why, when the conversation is about money rather than architecture, we point back to what we already wrote about the five-year maths of colocation versus public cloud, with the six line items almost nobody adds up in full.
11 kW in the headline, 7.8 kW once you take AI out
This is the part of the report we find most interesting and the part that got told least. There are three rack-density figures and they have to be read together, because on their own each one tells a different story:
- The modal density — the most common one — crosses 11 kW per rack for the first time. In 2025 it sat at 9 kW.
- But leave the ultra-high-density deployments out and average rack density goes from 7.5 to 7.8 kW. Three tenths in a year.
- And 24% of operators now report racks of 30 kW or more, against 19% last year.
The figure that travels alone through the headlines is the first one. The one that describes most rooms is the second, and the distance between them is the whole story: what separates 11 from 7.8 is not a year of growth, it is a handful of high-density deployments. Take those out and the market moves three tenths. The aggregate is not rising because everyone is rising a little; it is rising because a minority is going a long way up. That 24% now report racks of 30 kW or more, up from 19%, points the same way: the average is not shifting so much as the tail is fattening.
Why this matters to an ordinary company that will never build a training cluster: your problem is not 30 kW racks, your problem is that "normal" has moved. Nearly 8 kW is what an ordinary rack draws today, with no AI or anything like it, and the server you buy next year will not draw less. The uncomfortable question is not how fast the sector is climbing: it is how many kilowatts the room holding your rack was sized for, and whether anyone has looked at that since. It is the same undercurrent we already felt in the wallet with memory prices rising on the back of AI data centre demand: you do not need to be doing AI to pay for its consequences.
The 10% the headline does not mention
Go back to the sum: 46 plus 44 is 90. The missing 10% is the category Uptime describes as "IT rooms and server cabinets rather than a dedicated facility". That is a very polite description of something we all know: the closet. The converted office with a rack in it, a domestic split unit pointed at the door, a UPS bought six years ago, a single-phase circuit shared with the coffee machine, and the door propped open with a chair on hot days.
Put that room together with the previous figure and you get the only practical conclusion in the whole report. A rack drawing 8 kW dumps 8 kW of heat into that room, continuously, 365 days a year. That is not an opinion or a market trend: the energy coming in through the cable has to leave somewhere. A domestic split unit does not shift that on an August afternoon, and when the split stops on a Saturday nobody is watching and there is no second cooling machine waiting.
And here is what we actually think, after years of walking into those rooms: nobody moves the rack out of there because of a cloud strategy slide. It moves the summer the air conditioning stops on a Saturday. The decision is almost never intellectual; it is a recovery invoice, a disk killed by heat, or an insurer starting to ask questions. If you have got this far and you are adding up the kilowatts in your room, that conversation — where to put it and with what electrical guarantees — is literally what we do for a living.
There were fewer outages and they cost more
Another pair of figures that only make sense together. 47% of operators report having had an impactful outage in the last three years, down from 50% the year before: an improvement. But among those affected, 71% put the incident at $100,000 or more, against 57% a year ago. And the leading cause is still the same one it always was: power failures, at 56%. Not software, not cloud, not a cyberattack. Electricity.
The optimistic reading ("outages keep falling") is incomplete. What the two figures say together is that each facility concentrates more and more critical load, so each incident is worth more money. It is the same movement as the 46%: consolidate into fewer, bigger sites and you lower the frequency while raising the unit cost of failure. Changing building does not take you out of the electrical chain; it changes whose it is and — this is the important part — whether you can audit it. We went through this in detail in July's Google Cloud outage caused by power and cooling: a voltage dip lasting milliseconds, two feeds, and the room at 44 degrees two hours later. At hyperscaler scale, the same physics as the closet.
And one figure that does not fit the AI narrative
In the same survey, operators' confidence in AI applied to their own work falls in both categories that come with a year-on-year comparison. Those who believe it improves efficiency drop from 58% to 52%. Those who trust it to reduce human error sit at 40%, eleven points down. And then there are two figures published without a prior year, so we do not know whether they are rising or falling, but they speak for themselves: trusting AI to control equipment, 31%; to configure things automatically, 16%.
And this bit is ours, not the report's: the sector building the data centres for AI trusts AI less than it did last year to run them. We do not see that as a contradiction or an inconsistency. We see it as the people closest to the physical consequence of a mistake — a room at 44 degrees, a load transfer that does not happen — being the ones who ask for more evidence before delegating. It is exactly the criterion we apply to any automation: you automate what you know how to verify, and that last 16% says verifying a generated configuration is not a solved problem yet.
When we would not move
This comes from the people who would bill you for the move, so it counts double. There are three situations where taking the hardware out of the building strikes us as a bad deal, and we will say those before the good ones:
- When the server talks to a machine on the shop floor. Production control, data acquisition, a historian writing every second against a PLC ten metres away. There, latency and link dependency are not fixed with more bandwidth, and a line fault stops your factory rather than stopping your email.
- When there is a written contractual or regulatory reason about where the data lives. We do not argue with it: we read it and design around it.
- When the load is genuinely small. Two servers adding up to a kilowatt and a half, in a decent room, with a properly sized UPS and backups somebody has actually tried restoring: that does not need to move anywhere yet. Moving it to colocation adds a monthly fee and complexity to solve a problem you do not have yet.
Five questions before moving anything
- How many kW does your rack draw today, measured rather than estimated? And with the server due for purchase in three years, how many? If nobody knows the number, that is the first job and it costs nothing: read it off the PDU.
- What exactly happens at three on a Saturday afternoon if the power goes? Not the theory: how long the UPS really lasts with today's load, who shuts down, who starts back up and in what order, and whether the cooling restarts on its own when power returns.
- If you move, what do you take: the hardware or just the data? That answer decides whether you are talking about colocation or cloud. Different contracts, different risks, different exits — and confusing them is exactly the headline mistake this article is about.
- Who patches what, in writing? Hypervisor, operating system, application, array firmware. The unspoken split is the number one source of arguments six months in, and it always surfaces the day a critical advisory lands.
- How do you get out? Notice period, what format your data comes back in, what leaving costs and who does the decommissioning. If it is not written down before you sign, it does not exist.
What we would say
The 46% is not a verdict, it is a direction. And we should be fair to the argument: we do not know what share of that 46% is colocation and what share is SaaS either, because the report does not break it down. We are not saying the cloud has not grown. We are saying that this number, as published, cannot settle that argument in either direction, and that whoever used it last week to call the matter closed was asking the figure for something it does not contain. Part of that "off premises" — how much, nobody says — is people who took their own machines somewhere with the power done properly, which is a rather different decision from giving up on having them.
What we would not do, quite deliberately: use this 46% as an argument in a board meeting for a migration nobody has costed. A figure from an industry survey is not a business case, still less when the sample looks nothing like your company. Nor would we do the opposite — staying in the closet because "we have always had it here" — when the PDU reads eight kilowatts and the cooling is a domestic split. Between those two there is one afternoon's conversation with the numbers on the table, and we are glad to have it, recommending on the merits and not on the commission.
Sources (verified on 2 August 2026): all figures come from Uptime Institute's sixteenth annual global data centre survey, announced by Uptime in a press release on 28 July 2026 and covered by the trade press on the 30th, and from its coverage in Network World, Data Center Knowledge and The Register: the 46% / 44% / 10% split, the third-party category bundling colocation, cloud, hosting and SaaS, this being the first time in sixteen editions, the 48% against 42% projection for 2028, the modal density of 11 kW against 9 kW in 2025, the 7.8 kW average density (up from 7.5) excluding ultra-high-density deployments — Network World publishes both figures consecutively and in that order, and the contrast it draws is with and without those deployments —, the 24% of operators with racks of 30 kW or more against 19% the previous year, the 47% reporting an impactful outage over three years (down from 50%), the 71% of incidents at $100,000 or more (up from 57%), power failures as the leading cause at 56% and the AI confidence percentages (52% down from 58%, 40% down eleven points, 31% and 16%). An honest warning about those last ones: the 56% for power, the four AI figures and the 42% projection for 2028 are published by Network World alone; The Register says instead that the self-owned share stays flat, and on another figure from the same report (recruitment difficulty) Network World gives 51% where The Register and Data Center Knowledge give 53%. We have not been able to check those figures against the full report, which is paywalled. The methodology — more than 1,600 participants, over 800 owners and operators, fieldwork in April and May 2026, 52% in North America and Europe, close to a quarter working for third-party providers, and sample sizes varying by question because answering was not mandatory — comes from Uptime Institute's own press release and the coverage cited. The description of the 10% category as "IT rooms and server cabinets rather than a dedicated facility" is verbatim from the report. Ours, not our sources': that adding colocation and SaaS into a single category mixes opposite decisions, the table of five compared questions, the reading that what separates modal from average density is a handful of high-density deployments rather than a year of general growth, the thermal argument about the closet, the interpretation that fewer and costlier outages follows from load concentration, the observation about operators' confidence in AI, the three situations where we would not move, and the five closing questions. We have not measured how many Spanish SMEs sit in each of the three categories today and we are not going to invent it. Cover photo: "Server Room" by Carl Lender, Wikimedia Commons, CC BY 2.0.
How many kilowatts are in your room today?
We look at your real power draw with you, what happens the day the power goes, and whether you are better off staying, moving to colocation or splitting it. With the numbers on the table and no migrating because of a headline.
Talk to everyWAN
 Microsoft 365
 ES
ES  CAT
CAT  EN
EN